MSX Research Reports
Barriers to US EV adoption: What’s causing a States-wide divide?
Despite the steady development of electric vehicles (EVs) by OEMs across the globe and the timely pressure of emissions deadlines, the automotive industry continues to find itself in a chicken and egg situation. Consumer uptake of EVs relies on a sound infrastructure to support charging and maintenance requirements. But the development of infrastructure is costly, and EV-related businesses are less viable in markets where fewer people are purchasing EVs, limiting the incentives to spend money on infrastructure.
Today, some dramatic disparities in EV adoption are forming within markets. Nowhere is this more apparent than in the US. Here, federal government-led incentives are helping to encourage EV adoption, but local incentives vary from state to state. Meanwhile, the cost of traditional fuel remains low, and vast driving distances in the country make the sheer numbers of necessary charging stations difficult to achieve. Unsurprisingly, manufacturers in some parts of the country face greater reluctance from consumers.
Disparity in infrastructure
A US-based survey from Consumer Reports (1) revealed the top three reasons consumers are reluctant to choose plug-in EVs. They are, not enough public charging stations (48%), purchase price (43%) and insufficient driving range (42%).
The differences in adoption figures vary widely from state to state, with California taking a clear lead in the number of consumers choosing EVs. With a land area of 155,779 square miles (2), California is among the country’s largest states geographically, with the highest number of all electric light-duty vehicle registrations in the country – 425,300 (3) as of December 2020. It also has the highest penetration of all-electric vehicles, accounting for approximately 2.9% (3,4) of light-duty vehicles. The state’s governor recently pledged $3.2 billion to boost EV adoption (5) and has handed down an executive order to ban the sale of new gas-powered passenger cars and trucks by 2035 (6). But the state is also known for its incentives such as purchase rebates and exchange programs, and is investing heavily in infrastructure, ultimately helping the driving population to overcome range anxiety. Its 13,100 (7) charging stations equate to approximately one for every 12 square miles (2), meaning even the most anxious EV driver is unlikely to worry about running out of charge.
Despite being a third of the size of California, with a land area of 47,126 square miles (2), New York State has a similar concentration of light-duty vehicles (2,4) (including cars, pick-up trucks and vans) to California. But fewer than 1% (3,4) of light duty vehicles are all-electric, even though charging stations are relatively plentiful – more than 2,500 (7), or approximately one station for every 18 square miles (2,7). In the US, a higher availability of charging points does not necessarily translate to a higher adoption of EVs. A clear division is apparent between the west coast and east coast in terms of the relationship between infrastructure maturity and adoption (see infographic US states by BEV penetration and infrastructure maturity on page 3). In California, higher EV adoption and high charging maturity levels appear to go hand in hand. Other west coast states show relatively good levels of EV adoption, but poorer charging infrastructure. In comparison, on the east coast, the relatively solid infrastructure is not as strongly associated with a significant increase in EV adoption.
US states by BEV penetration and infrastructure maturity
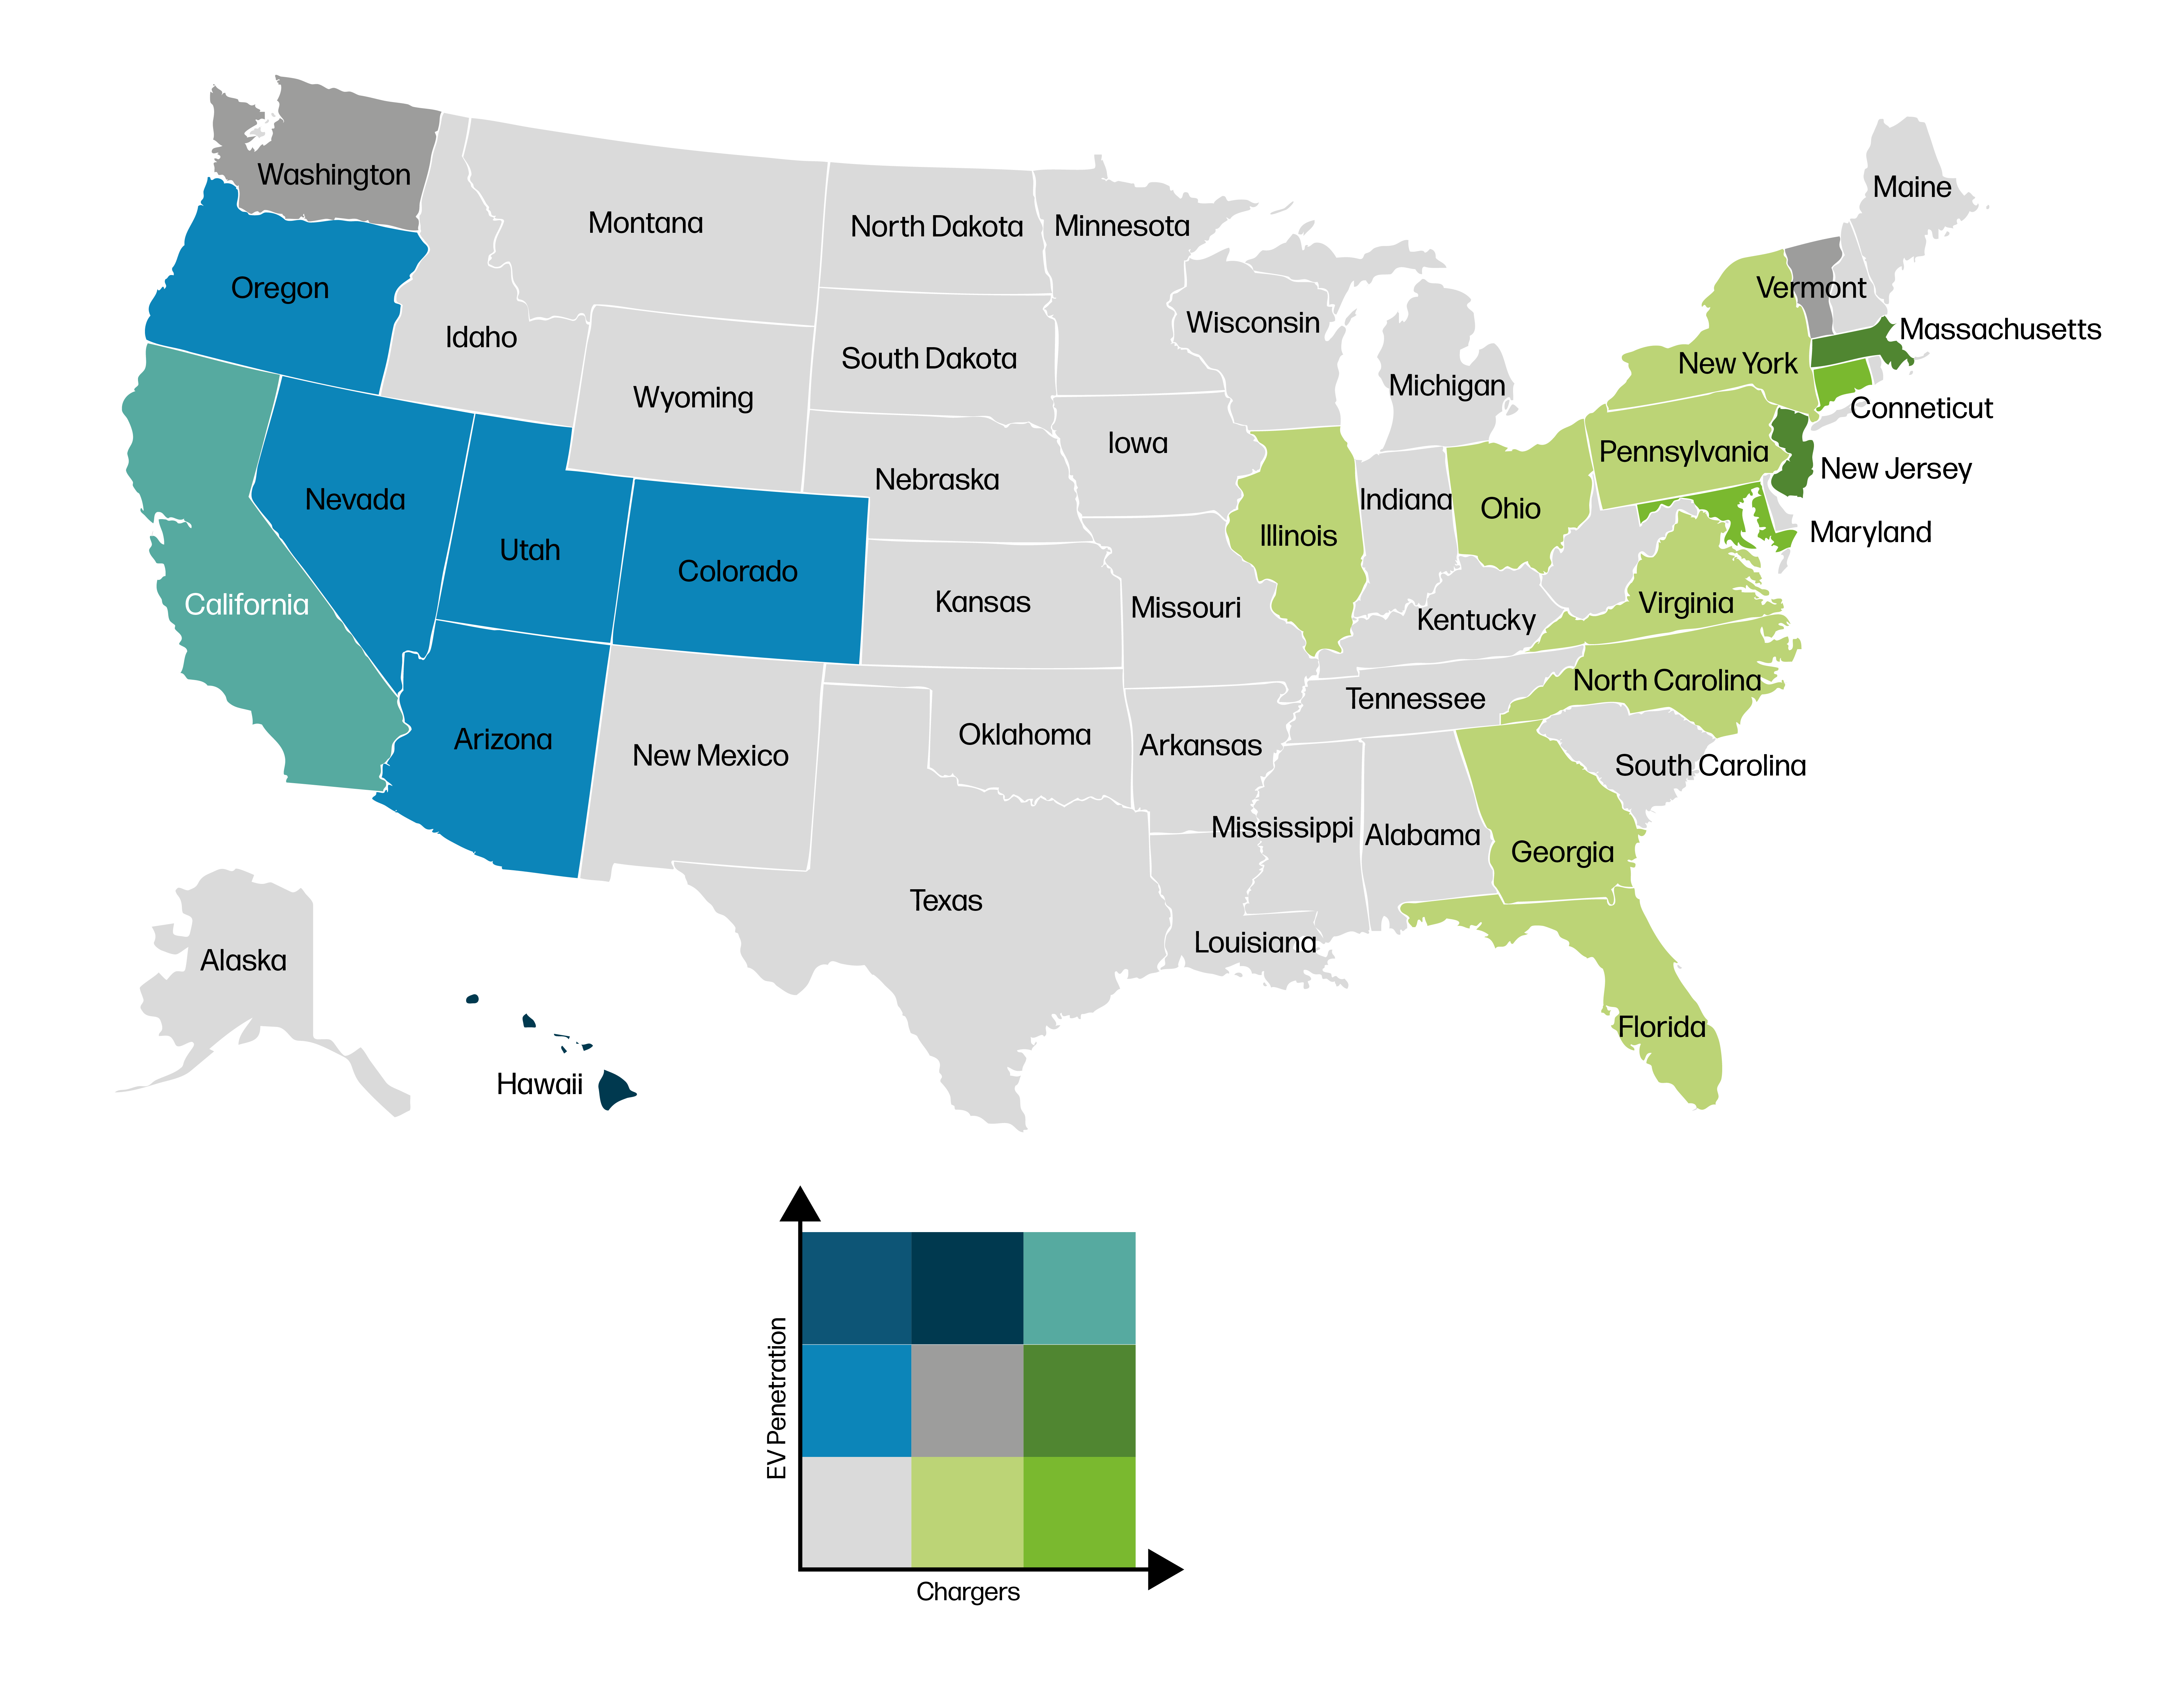
This graph shows displays the all-electric vehicle penetration and charging infrastructure maturity by US state.
MSX data analysis shows high infrastructure and high EV adoption on the West Coast, versus high infrastructure and low adoption on the East Coast. Central states show both low EV infrastructure and low EV adoption.
The estimated electric vehicle penetration is calculated using the total number of all-electric, light-duty vehicles registered in each state at the end of 2020, and the total number of automobiles (private, commercial, and publicly owned) registered in each state in 2019.
The charging infrastructure maturity is based on the number of publicly accessible electric vehicle charging stations per square mile of land area in each state.
The cost, location and speed of charging
There are multiple factors that may account for this. Firstly, consumers’ reluctance to choose EVs could relate to the costs associated with recharging a vehicle. While the cost of electricity itself is relatively inexpensive or, in some instances, free, some charging stations are located in pay garages which charge drivers a premium to park their cars. The table below, which presents available data on the types of facilities at charging locations, shows that the top five states with the highest proportion of chargers in pay garages (7) are all located on the east coast.
Electric vehicle charging outlet location distribution for select states
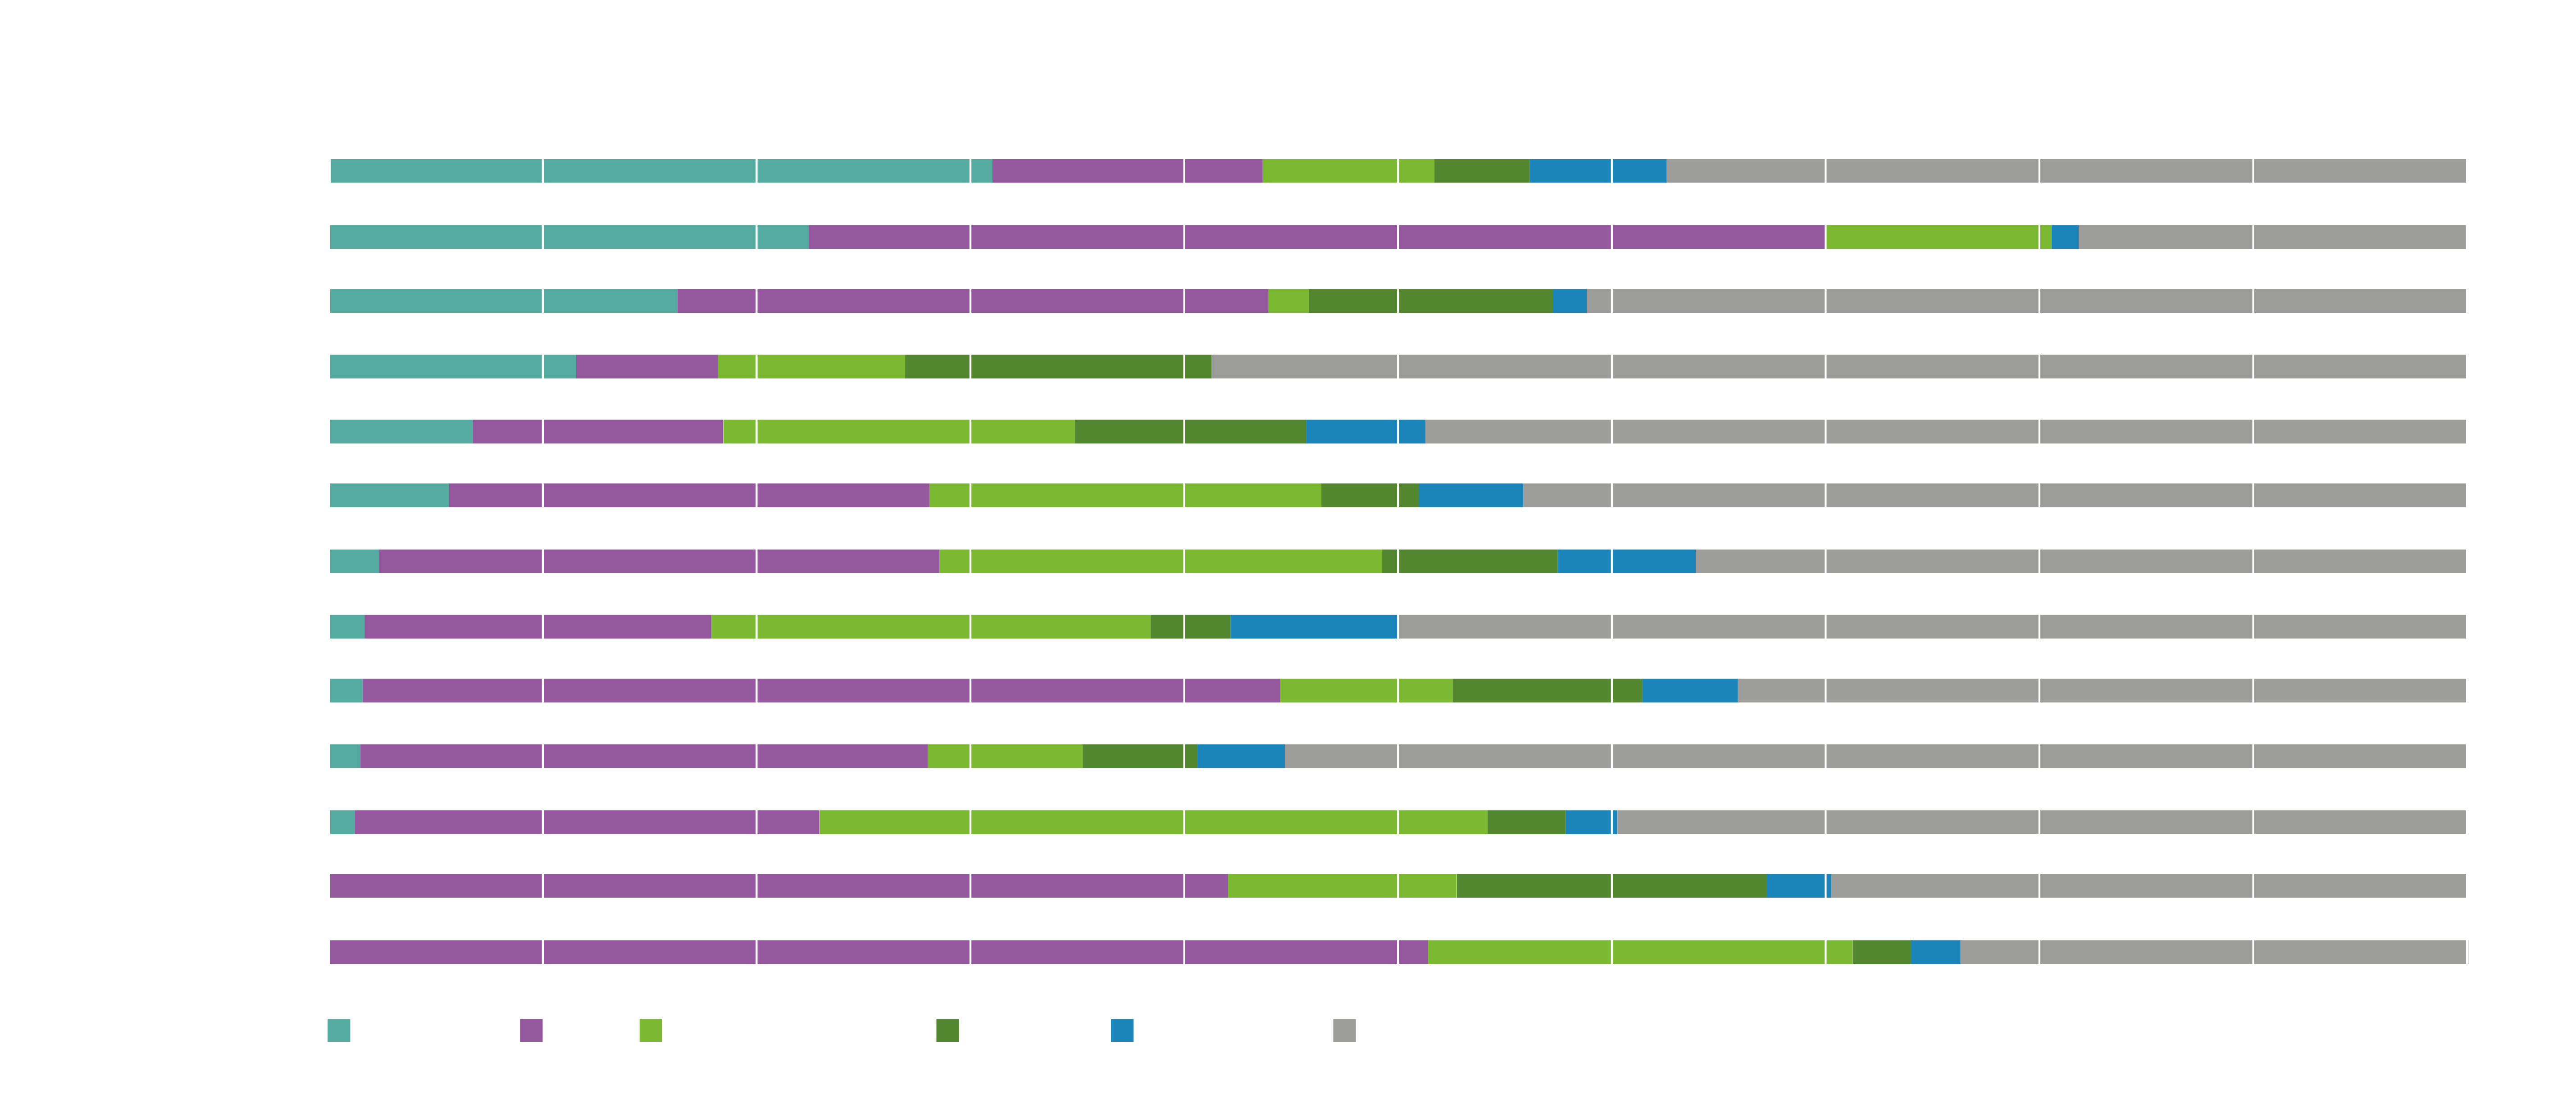
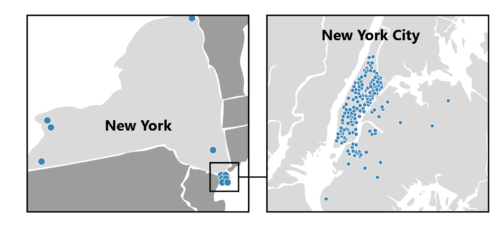
The data also shows that in New York, 31% of chargers are located in pay garages, compared to just 1.6% in California. These pay garages, as shown on the map below, are located primarily in the more densely populated area of New York City where more people live in apartment blocks without home charging options. And, according to the 2019 US Census, only 45% of households in all of New York State have a garage or carport versus 85% in California (8).
Unsurprisingly, the Consumer Reports survey (1) shows that people living in apartments think they’d mostly use public fast charging stations if they owned an EV. But it seems they would have little choice but to pay for costly pay garages, all while running the risk of the charger being in use when they arrive. These access issues are almost certainly unappealing to drivers.
So too, is the lack of fast charging options. In New York State, only 10% of its chargers are fast chargers, compared with California which boasts fast chargers in 17% (7) of cases. Fast chargers are more powerful units, which can charge the vehicle to 80% in less than an hour, or even as little as 20 minutes. By contrast, standard chargers can take hours.
Hurdles for central states
The citizens of central states, without the support of EV infrastructure, are understandably slower to adopt EVs. Arkansas, a state roughly the same size as New York State with a land area of 52,035 square miles2, has a far lower concentration of total vehicles (2,4). But it also has the lowest percentage of EV registrations in the country – just 0.06% (3,4). Here, the infrastructure is just 124 (7) charging stations, or roughly one for every 420 square miles (2,7).
Socio-economic factors add to the disparity in adoption. While purchase prices are coming down, EVs are still comparatively expensive to buy at around $7,000-$14,000 more than an internal combustion equivalent (9), so may, for now, be less accessible to consumers with lower salaries. The 2019 US Census figures show the relative differences in household incomes from state to state. They reveal the median household income in Arkansas was around $49,000 versus $80,000 in California and $72,000 in New York. (10) While the higher levels of income may contribute to higher EV adoption in the western states, on the east coast, the barriers of charging costs and convenience appear to outweigh the benefits of higher income.
Unlike California which allows the direct sale of all motor vehicles, Arkansas is also among the states in which direct-to-consumer sales of all motor vehicles is prohibited. This means that Tesla, which doesn’t use a retail network, and any manufacturer aiming to adopt a direct sales model for the sale of EVs, cannot operate using this model in the state. Licensing surcharges for EVs in Arkansas also add hundreds of dollars onto the cost of EV adoption for customers (11).
Breaking down barriers
However, EV initiatives are beginning to emerge in central states. Funding is growing and programs such as ‘Adopt a Charger’ which encourages sponsors to adopt and fund chargers in return for marketing opportunities (12), are helping broaden EV infrastructure in states such as Arkansas. Across the country, the federal government is encouraging US consumers to embrace EVs as a viable part of the powerful economic force that is the American automotive industry. A statement from The White House has announced its commitment to extending EV infrastructure significantly, but in a way that will support workers and expand the numbers of union jobs (13). And in a new bid to tackle climate change, the government has announced an executive order aimed at making half of all new vehicles sold in 2030 electric (14). It has also proposed new vehicle emissions standards to cut pollution, starting with a 10% stringency increase from 2023.
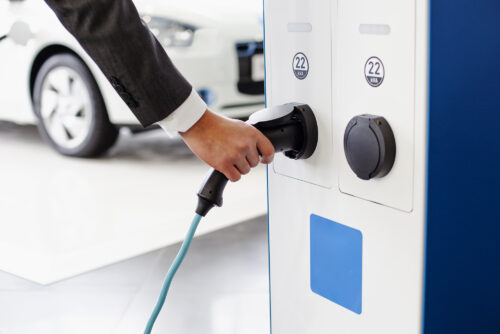
Meanwhile, consumers’ cost concerns are being addressed through free charging schemes such as that offered under the agreement between Electrify America and Mercedes-Benz USA. The arrangement offers drivers 30 minutes of free charging per session for the first two years of vehicle ownership (14).
It’s possible consumers who have already taken the leap into EV ownership may hold the key to easing the range anxiety of others. A European-based survey of 7,000 EV and ICE vehicle drivers, conducted by Nissan (15), shows a high EV-driver satisfaction. The survey shows 97% of EV drivers found the transition from ICE to EV ‘as expected’ or ‘easier’ and 70% of motorists admitted the range autonomy of their EV was better than expected before purchase.
This may be because an EV’s range on a single charge exceeds most users’ needs. A standard EV will travel at least 150-200 miles on a single charge, yet the average US motorist drives just 33 miles a day (16).
The transition to EVs in many markets may be slow, especially where infrastructure is yet to be prioritized. But in those where the infrastructure is adequate, it’s a matter of helping consumers understand how the benefits outweigh the risks. It’s likely that as more consumers make the switch and share their positive experiences with others, purchase momentum will accelerate. It’s up to the manufacturers to provide channels through which the buying public can connect, and ensure their retail networks provide customers with the right support along the way.

What role can dealers play?
Dealers must approach the sale of EVs, not just by adapting their knowledge to answer questions about the electric powertrain and its benefits, but by completely reframing the generations-old sales narrative to which they’ve become accustomed. EVs are not just a new line in vehicle type, but the soon-to-be dominant vehicle type, and the dealer is tasked with educating customers in time to meet the targets enforced by the manufacturers themselves as well as looming emissions deadlines.
The benefits to consumers of owning and driving EVs are overwhelming, with multiple purchase incentives such as the use of special vehicle lanes, cheaper registration fees and free parking, to name just a few. But equally overwhelming is the change for consumers as they navigate these incentives and overcome their concerns. Issues such as income tax rebates for buyers of new EVs continue to be a minefield. According to Forbes (17), the new rules and parameters of rebates that were proposed in a senate bill earlier this year will vary depending on the retail price of the vehicle, the vehicle model, where the vehicle was manufactured and whether it was built using union labor. Salespeople must be able to navigate these complexities, while being able to tell a customer which model of vehicle will best suit their driving distances or lifestyle, where the closest charging points are and whether a charger is feasible in their driveway at home.
For more information on how MSX can help your business better support customers and accelerate EV sales, contact ….
References
(1) Consumer Reports. (2020). Consumer Interest and Knowledge of Electric Vehicles: 2020 Survey Results. Retrieved from https://advocacy.consumerreports.org/wp-content/uploads/2020/12/CR-National-EV-Survey-December-2020-2.pdf
(2) United States Census Bureau. (2010). State Area Measurements and Internal Point Coordinates. Retrieved from https://www.census.gov/geographies/reference-files/2010/geo/state-area.html
(3) U.S. Department of Energy Alternative Fuels Data Center. (2021). Electric Vehicle Registrations by State. Updated June 2021. Retrieved from https://afdc.energy.gov/data/10962
(4) U.S. Department of Transportation Federal Highway Administration. (2020). State Motor-Vehicle Registrations – 2019. Retrieved from https://www.fhwa.dot.gov/policyinformation/statistics/2019/mv1.cfm
(5) Associated Press. (2021). Newsom’s green budget has something for everyone — even bees, 15 May. Retrieved from https://apnews.com/article/ca-state-wire-bees-business-climate-change-health-8b78934095916bd196245a2a853506d0
(6) The Sacramento Bee. (2021). Think you can’t afford an electric car? California wants to help drivers make the switch, 8 June. Retrieved from https://napavalleyregister.com/news/state-and-regional/think-you-cant-afford-an-electric-car-california-wants-to-help-drivers-make-the-switch/article_737c010b-f058-5fb3-b379-ec05381badb5.html
(7) U.S. Department of Energy Alternative Fuels Data Center. (2021). Alternative Fueling Station Locator. Retrieved from https://afdc.energy.gov/stations/#/find/nearest on 29/06/2021.
(8) United States Census Bureau. (2019). American Housing Survey. Retrieved from https://www.census.gov/programs-surveys/ahs/data/interactive/ahstablecreator.htmls_areas=35620&s_year=2019&s_tablename=TABLE2&s_bygroup1=1&s_bygroup2=1&s_filtergroup1=1&s_filtergroup2=1&s_show=SO
(9) Forbes. (2021). Internal Combustion Cars Will Be An Expensive Luxury Compared To Electric By 2027, 15 May. Retrieved from https://www.forbes.com/sites/jamesmorris/2021/05/15/internal-combustion-cars-will-be-an-expensive-luxury-compared-to-electric-by-2027/?sh=1429a89e5189
(10) United Status Census Bureau. (2020). Household Income: 2019. American Community Survey Briefs. Retrieved from https://www.census.gov/content/dam/Census/library/publications/2020/acs/acsbr20-03.pdf
(11) Consumer Choice Center. (2021). United States Electric Vehicle Accessibility Index. Retrieved from https://consumerchoicecenter.org/united-states-electric-vehicle-accessibility-index/
(12) Adopt a Charger. (2021). Charge Up! Arkansas encourages adoption of electric vehicles, 26 January. Retrieved from https://adoptacharger.org/charge-up-arkansas-encourages-adoption-of-electric-vehicles/
(13) The White House. (2021). Readout of the White House’s Meeting with Electric Vehicle Charging Infrastructure Leaders, 2 March. Retrieved from https://www.whitehouse.gov/briefing-room/statements-releases/2021/03/02/readout-of-the-white-houses-meeting-with-electric-vehicle-charging-infrastructure-leaders/
(14) Reuters. (2021). Biden seeks to make half of new U.S. auto fleet electric by 2030, 6 August. Retrieved from https://www.reuters.com/business/autos-transportation/biden-set-target-50-evs-by-2030-industry-backs-goal-2021-08-05/
(15) Electrive.com. (2021). VW’s Electrify America strike a deal with Mercedes USA, 20 June. Retrieved from https://www.electrive.com/2021/06/20/vws-electrify-america-makes-deal-with-mercedes-usa/
(16) Nissan Motor Corporation. (2021). Tipping point: 70% of European drivers would consider an electric vehicle as their next car, 7 April. Retrieved from https://europe.nissannews.com/en-GB/releases/release-28eae03fe94ddcb16808bdb0bc0d2a15-tipping-point-70-of-european-drivers-would-consider-an-electric-vehicle-as-their-next-car
(17) Car and Driver. What is average mileage per year? Retrieved from https://www.caranddriver.com/research/a32880477/average-mileage-per-year/
(18) Forbes. (2021). A Bigger Tax Credit For Going Electric: What It Could Mean For Consumers, 29 June. Retrieved from https://www.forbes.com/wheels/features/12500-tax-credit-for-electric-vehicles-what-it-means/
